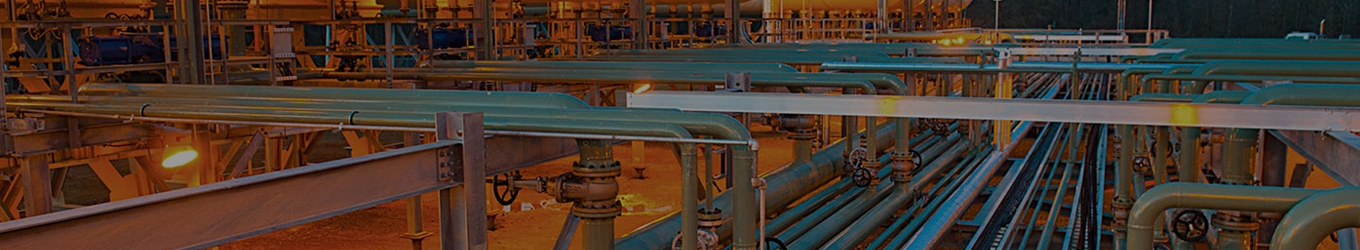
India’s Current Status on Natural Gas
The base case originates in Oman at the Middle East Compression Station (MECS) and ends in India at the Gujarat Pipeline Receiving Terminal (GPRT).
As we can see, multiple sources of energy are currently being used in the nation. The Indian Gas Market is expected to be one of the fastest growing in the world over the next two decades.
The Indian economy has been projected to achieve an average real GDP growth of 6.4% during 2008- 2035.
| Source | 2010 | 2025 |
|---|---|---|
| Coal | 53% | 50% |
| Oil | 30% | 25% |
| Gas | 11% | 20% |
| Hydro | 5% | 2% |
| Nuclear | 1% | 3% |
| – | 100% | 100% |
Energy availability is key to economic growth and therefore, going forward high economic growth would lead to increase in the energy consumption of the country. The primary energy mix of India is also set to alter on account of the substitution of oil by natural gas. The share of natural gas in the energy mix is expected to increase to 20% in 2025 and beyond as compared to 11% in 2010. Based on the plans for expansion in natural gas supply in the country with the help of additional RLNG terminals, nation-wide transmission pipeline network and transnational pipelines expected to materialize in next 5 to 10 years, it is envisaged that the share of natural gas in the primary energy mix would reach 20% till 2030.
However to achieve a 20% share of natural gas in the primary energy it is required to attract and sustain investments in the gas infrastructure including the cross country pipelines [Source : As per Hydrocarbon Vision 2025 report]
India’s domestic Natural gas comes from the Bombay High fields, Panna Mukta & Tapti fields, Ravva field, KG basin etc. India also imports LNGA to meet the demand-supply gap of natural gas, but LNG is more expensive than Natural Gas.
In future, the natural gas demand is all set to grow significantly at a CAGR of 6.8% from 242.6 MMSCMD in 2012-13 to 746 MMSCMD in 2029-30.
The consolidated demand for natural gas from 2012-13 to 2019-30 has been summarized.
| MMSCMD | 2012-13 | 2016-17 | 2021-22 | 2026-27 | 2029-30 |
|---|---|---|---|---|---|
| Power | 86.50 | 158.88 | 238.88 | 308.88 | 353.88 |
| Fertilizer | 59.86 | 96.85 | 107.85 | 110.05 | 110.05 |
| City Gas | 15.30 | 22.32 | 46.25 | 67.96 | 85.61 |
| Industrial | 20.00 | 27.00 | 37.00 | 52.06 | 63.91 |
| Petchem/Refineries/Internal Cons | 54.0 | 65.01 | 81.99 | 103.41 | 118.85 |
| Sponge Iron/Steel | 7.00 | 8.07 | 10.00 | 12.19 | 13.73 |
| Total Realistic Demand | 242.66 | 378.06 | 516.97 | 654.55 | 746.03 |
[Source: Vision 2030 PNGRB]